This post is part of a series: introduction (I), adoption (II), activity (III), work hours (IV), generations (V), and coda (VI).
When selecting an application, it’s very common to consider technological factors -what the application enable us to do?- and economic ones -how much money do we need? And yet, there is a third factor to take into account, the social aspects of the project: the community of users and developers who support it and make it be alive.
During a series of posts, I’m going to show a quantitative analysis of the communities of three free software projects in the Geographical Information Systems sector: GRASS, gvSIG and QGIS. They are the more mature projects in the space, they are under the OSGEO Fundation umbrella, and they show some differences on culture and organization.
The authors
The results that I’ll show come from a paper I led jointly with Francisco Puga, Alberto Varela and Adrián Eirís from CartoLab, a research laboratory from the University of A Coruña. The results were published on the V Jornadas de SIG Libre, Girona 2010. If you are fluent in Spanish (reading or listening), you can benefit from these resources:
- (in Spanish) The complete paper [PDF].
- (in Spanish) The slides [PDF].
- (in Spanish) Video explaining the highlights
From those who can’t, I’ll summarize the main points through small posts on this blog. The original authors have not reviewed the text as published, so consider any opinion expressed here as my own.
The idea
During the more than 25 years of free software movement, it has delighted us with the high capacity for fostering creation and innovation a community-based model has. Along last years, that model proved its viability in other areas too: content creation (wikipedia), cartographic data creation (openstreetmaps), translating books, etc. Yet, few is known on “how to bootstrap and grow a community”. The only thing we can do is observing what others have done and learn from their experience.
In order to contribute to the understanding on how a community-based project works I’ve work with Francisco Puga and other people from Cartolab to put together some of the public information the projects generate and make some sense from that. The actors in a community interact with each other, and, when that happen through internet, a trail is left (messages to mailinglists have author information and date, code version systems log information about the authors too, …). Basing our work on this available and public information -and standing on the shoulder on giants –i.e: reviewing a lot of research works similar to what we like to build- we have developed a quantitative analysis on the communities supporting GRASS, gvSIG and QGIS.
Public datasets
The first step was to evaluate and gather all the public information a project, for what we like to do it in automated way. But, as we had to compare the 3 projects, the data had to be homogeneous: at least exists in both 3 and be in a comparable format. Taking these constraints into account (and the limited time we had for this!) we have collected information from 2 different systems:
- Code versions control systems: from every project, we cloned all information available in their repositories to a local git repo, in order to parse the log of changes. This allowed us to study all the history of projects, from the very begining to December 2010.
- Mailinglists: by means of mailingliststats tool -built mainly by our friend Israel Herráiz, thanks bro!– we gather data from March 2008 to December 2010.
Some disclaimers:
- Projects have a number of branches, plugins and so. We focused the study on the main product, what an user get when she downloads it. Further study on the plugins ecosystem is needed, and it will give us more fine-tuning information.
- Projects have a number of mailinglists more than we have studied (translators, steering committee, other local/regional mailinglists, etc), varying on each case. The analysis was focused on developers and users ones due to we think they are representative enough to mark the trend. We are not interested in giving an exact number (which may be impossible to measure!) but in drawing the long-term fluctuation of participation. Our intuition and past experiences, says that those mailinglists will follow a correlation of participation with the larger community surrounding the projects.
- In the particular case of gvSIG users mailinglists, we have studied spanish and english mailinglist jointly. It makes sense doing so as the spanish mailinglist still have the core of contributions from hispanoamerican countries and non-spanish people interacts through international mailinglist. It is like the project have two hearts.
- Unfortunately, quality of data have limited the period in study: the range is from March 2008 to December 2010. Prior to that, not all projects have information due to mailinglist migrations.
What is it useful for?
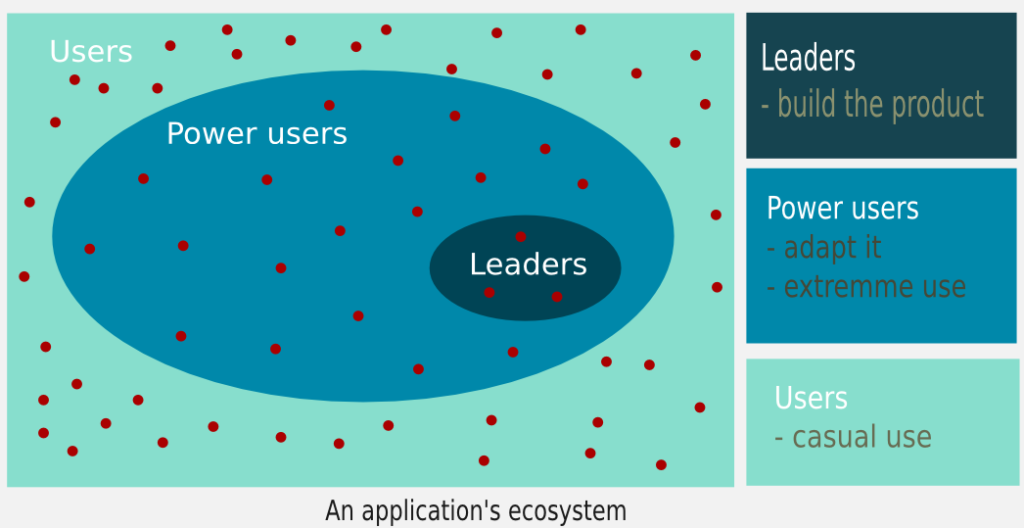
It’s possible to analyze a community from a variety of points of view. Our approach is a quantitative focus by means of a common model which agregate users depending on their level of participation:
- Leaders: those who build the product and make the decisions.
- Power users: those who adapt it to their needs and using it intensively.
- Casual users: those who using it for a concrete task.
This approach allow us to better understand the size of the community and how they interact, as it’s not the same the value provided by someone who in 6 months only sent 1 mail to a mailinglist than other person who spent that time sending more than 100 patches to the code.
With these constraints, we managed to built the following indicators:
- Adoption trend within users and developers: based on mailinglists data.
- Status: post published.
- Activity and manpower: based on code contributions (commits).
- Status: post published.
- Composition of the community: based on code contributions (commits).
- Status: post published.
- Generational analysis: based on code contributions (commits).
- Status: post published.
During next weeks, I will be publishing the results of the study, in order to help us to understand how different free software communities work, and what we can learn from that.
Leave a Reply