This post is part of a series: introduction (I), adoption (II), activity (III), work hours (IV), generations (V), and coda (VI).
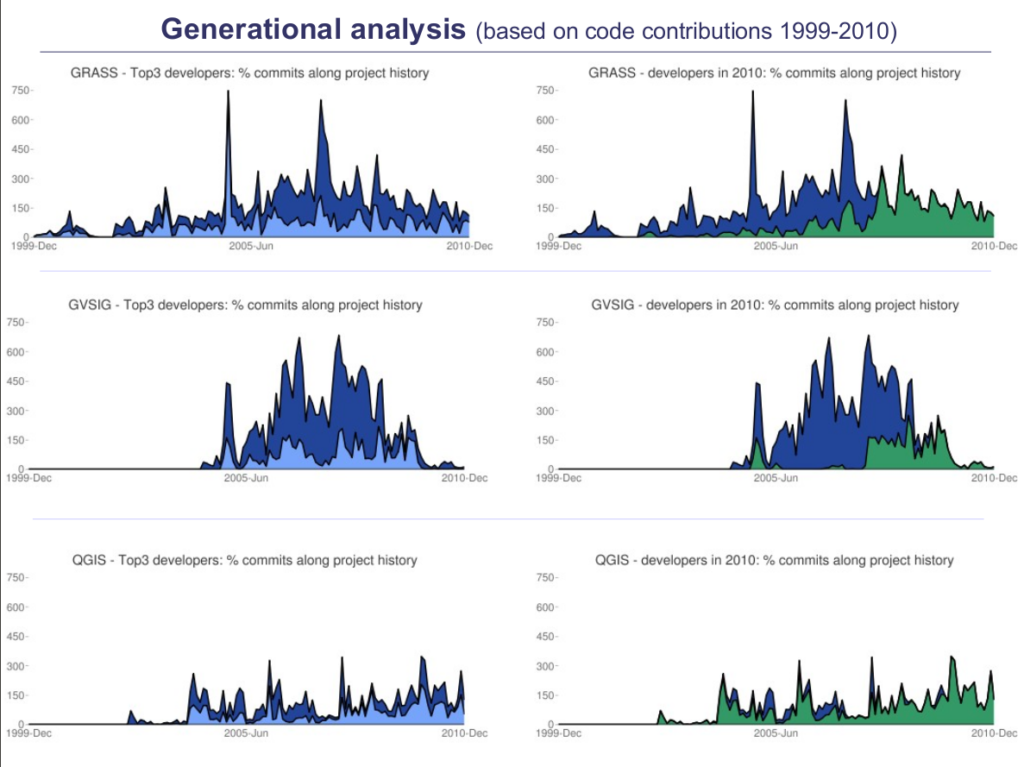
- Images: on the left, contributions of top 3 developers along the project history; on the right, evolution of developers participating during 2010.
- Data: trunk from project repositories during the period 1999-2010.
Data patterns
This indicator gives us some sense on how the leadership changed and how the knowledge transfer was done in every project. The paper elaborates a bit more the points of turnover and integration of new blood in the project (highly correlated with this indicator) with statistics of top 10 developers.
All that will give us some insights on every project:
GRASS
- The charts and data depict how a new generation took over the leadership from 2005 onwards. The process seems to be happened in a very organic way -in the sense that people grew its skills at a steady pace for a long time- and also deep to the roots: from the top10 only 4 out of 10 people continue collaborating with the project.
- The data also shows how the top3 represent half of the work in the project, which suggest that several developers are highly involved with no one having too much influence (actually, the top contributor during 2010 means 40% of work).
gvSIG
- The charts and data depict a highly distributed team with a high rate of turnover. Top3 is responsible for less than half of the contributions, being top10 around 60%. The change of leadership happened very quickly around 2007 and only 2 out of 10 contributors from top 10 kept working in 2010.
- Besides, the top10 shows a homogeneous involvement in terms of number of contributions, which may reflect that all of them had a similar role and impact in the development of gvSIG.
QGIS
- The charts and data depict a project dependent of its top3 with a contributions-friendly culture. Top3 activity means a high rate of contributions over total but seems they have integrated well new blood as 9 out of 10 most active developers working in QGIS have started in different years and continue involved.
- Top10 people have different ratios of involvement, ranging from 6% to 50%, which may reflect the heterogeneity of its core developer base (from volunteers to full-time developers).
Leave a Reply