This post is part of a series: introduction (I), adoption (II), activity (III), work hours (IV), generations (V), and coda (VI).
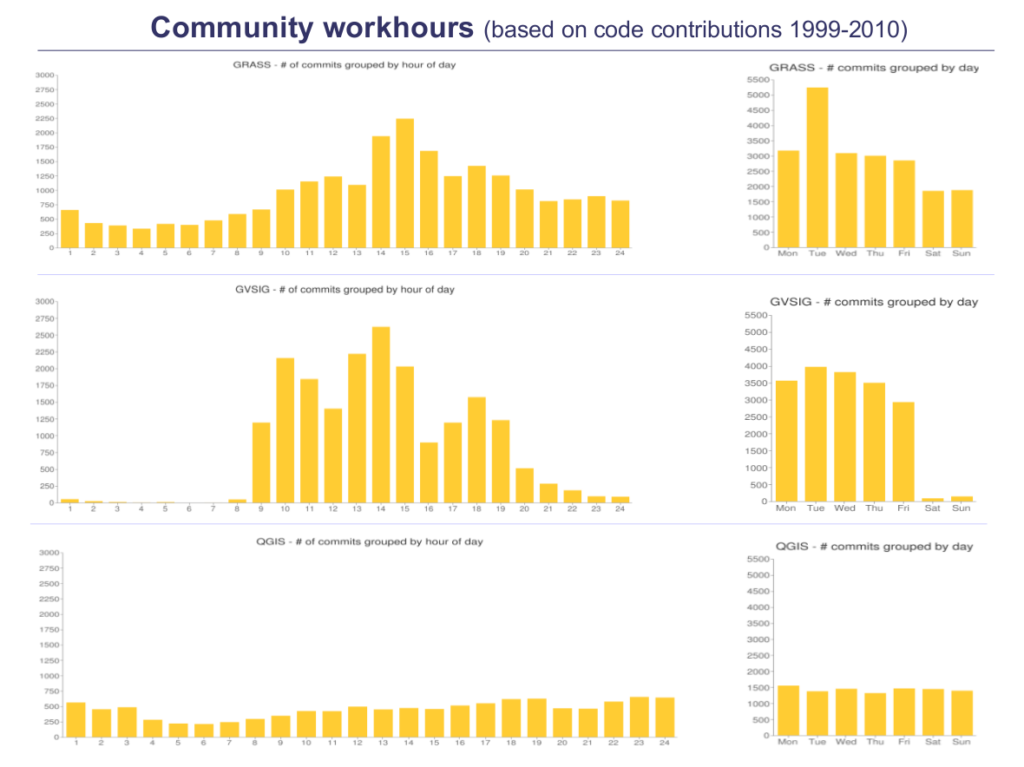
- Images: on the left, number of changes to the codebase (commits) agregated by hour of day. On the right, number of commits grouped by day.
- Data: trunk from project repositories during the period 1999-2010.

Data patterns
This indicator is intended to give us some information on the patterns of behavior of contributors. Specifically, we can track how is a typical week for the core developers in every project: the timeline shows when the integration happened, don’t reflect the time in which the work was done; so it’s telling us the history of people with commit permissions, what we know as the leaders.
Let’s try to extract some information from there:
GRASS
- Internationalization: the hourly chart represents a gauss bell centered on 15h GMT, which in most European countries would be after lunch, being morning in the Americas. That could reflect that both continents represent the vast majority of core commiters. Nevertheless, the work is relatively well distributed along different hourly zones.
- Volunteers: the daily chart shows a light drop of work during the weekend, likely due to hired developers or people who likely make contributions mostly within their working hours. Nevertheless, there is still a high rate of contributions being integrated during weekend, which may be a sign of a well stablished volunteer base of core-developers.
gvSIG
- Internationalization: almost all the integration happens in a journey from Monday to Friday, with a hourly range from 09:00 to 20:00 GMT. That is strongly correlated to the hours of opening of a typical shop in Spain and reflects the nature on how the application was built in that period: led by a public body which contracted development to Spanish firms.
- Volunteers: seems that volunteer work in core was reaching to none, which reflects the original nature of the project in that period.
QGIS
- Internationalization: the hourly chart is nearly to a plain rate of contributions, which is a strong sign of a highly distributed leadership along the world. It’s even difficult to suggest which zones would be the prominent in terms of developers.
- Volunteers: the daily chart reflects a steady work along the week, with no signs of falling during the weekend, which may be related to a strong base of volunteers core commiters.
Leave a Reply